The power of Pound Cost Averaging
Chris Broome – Chartered Financial Planner
Achieving a good outcome from long-term investing requires an understanding that capital market cycles are an inevitable part of how capital markets behave.
Throughout our personal investment journey, we’ll each experience moments when capital markets are rising (on average 75% of the time) and when they’re experiencing short-term volatility (on average 25% of the time).
History teaches us that our rational behaviour and discipline always is the best predictor of long-term returns.
In particular, the wisdom to keep putting savings into the market during temporary declines has the potential to add enormous additional return compared with a fearful response that shifts those savings into cash.
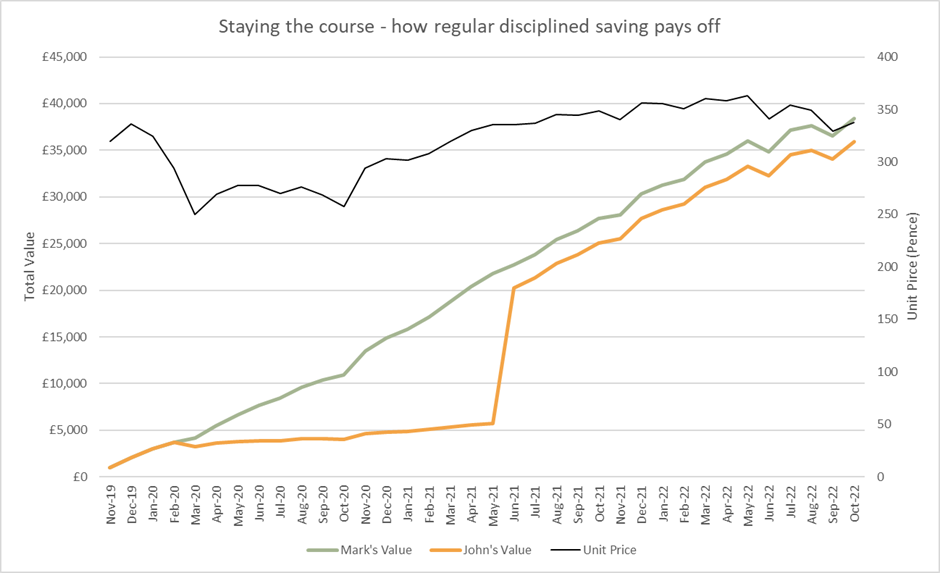
The chart below shows a real-life example based on the returns from a UK All-Share tracker fund between November 2019 and October 2022 – a period of both significant volatility and growth.
Mark and John each begin a long-term saving plan in November 2019.
They invest £1,000 per month into the fund.
The first two months show good numbers, the portfolio increases in both months.
However, the consecutive months of losses in January and February 2020, as the COVID crisis goes global, give John concerns about the future.
He doesn’t withdraw the £4,000 he’s saved so far, but he lets the regular contribution build-up in his current account instead, where he receives no interest.
Mark on the other hand, continues with his regular £1,000 monthly savings into the fund.
John is tempted back in June 2021 with the improving market situation.
He invests a lump sum of £16,000 the amount he’d let build in his current account through the missed regular contributions.
The chart shows the value of their respective investments on the left axis.
The black line, plotted on the right axis, shows the changing monthly unit price.
They both continue their £1,000 monthly savings for the rest of the period shown.
Throughout 2020, Mark’s disciplined monthly saving has, by June 2021, bought him 6,781 units in the fund.
During that period between March 2020 and November 2020 particularly, he’s been buying more units when the value has been lower.
When John adds his £16,000, he brings his total unit holding up to 6,030.
Mark and John have invested the same amount of money, £20,000, to their fund holdings.
However, the cost of John stopping his regular contributions and waiting for the market has cost him 751 shares in the fund.
Effectively, John has bought his shares in the fund at a higher price.
The impact on John’s investment, compared with Mark’s, will endure for the entire period of ownership. John can’t recover this lost value.
Let’s show how this has impacted the financial returns each has received.
Mark |
John |
|
Total Investment |
£36,000 |
£36,000 |
Final Valuation |
£38,442 |
£35,904 |
Total Return £ |
£2,442 |
-£96 |
Total Return % |
6.78% |
-0.27% |
Annualised % |
2.21% |
-0.09% |
The unfortunate irony of this example is that John, whilst believing he was acting cautiously, has ended up with a lower fund value than Mark.
He is currently showing a negative return over the three years, a result of his time out of the markets.
What do we learn by this example?
When we’re still accumulating wealth and saving for our future (or, for our family’s future), we need to:
- Embrace short-term market volatility.
- See these moments as new ‘buying’ opportunities.
- Which we’ll automatically capture if we’re making regular monthly contributions into our financial plan.
- And we’ll further capture if we make additional ad hoc contributions when it’s clear we’re experiencing a period of market/global instability.
- Because if we do this, like Mark does in our example, then over the long-term you’ll be more successful than 99% of your neighbours (figuratively speaking).
TIME IN THE MARKETS.
NOT, TIMING THE MARKETS.
Any questions?
If you have any questions in relation to any of the above, please do not hesitate to get in contact with me or one of the team.
Compliance notes:
- The value of investments may go down. You may note get back the original amount invested.
- The fund used is the Legal & General UK Index Trust, which aims to track the performance of the FTSE All-Share Index.
- All figures ignore any custody or broker costs associated with buying and holding the fund, which would reduce the returns.
Build notes:
- Data from FE Analytics:
- 36 monthly periods between November 2019 and October 2022
- £1,000 per month saving
- Investor A stays invested the whole time
- Investor B bails into cash between March 2020 and May 2021 then invests the savings into the fund in June 2021
- 16 months, or £16,000, goes in at the end of June
- They both keep investing £1,000 thereafter.
- The fund used is GB00B0CNGN12


